If you are interested in trading, investing, or analyzing markets, you have probably come across TradingView. In this article, we want to explain in detail what TradingView is, provide step-by-step instructions, and introduce you to the most important functions and tools so that you can improve your trading strategies and expand your skills.
TradingView is one of the most popular charting platforms in the world and is used by millions of traders, investors, and analysts. TradingView is a cloud-based charting software that can be easily used with all common modern web browsers (such as Google Chrome, Mozilla Firefox, Safari, or Microsoft Edge). While common charting software must be installed locally on computers, TradingView provides a successful alternative. All possible changes to the charts, such as drawings and analyses, can be saved in the respective user account and thus secured in the cloud. On the next login with the web browser (from anywhere), you will find everything as you left it. For some time now, there has also been an app from TradingView. The app and the web browser application do not differ essentially. They both have the same range of functions, and the data is also synchronized.
In addition to the actual functions of the charting software, TradingView includes some social aspects such as chats, following other traders, and the comment function below each published idea. There is also the option to write and publish your own scripts in the programming language "PINE," so that other traders can also use them.
Getting Started with TradingView
Pricing and Subscription Models of TradingView
TradingView offers four different subscription models. The free version called "Basic" and three paid subscription models (Pro, Pro+, and Premium). In the following image, however, you will only see the three paid subscription models of TradingView. The free version is a little hidden further down the page. The image also lists the essential differences and limitations directly. A detailed comparison can also be found on the website.
Creating a Free TradingView Account
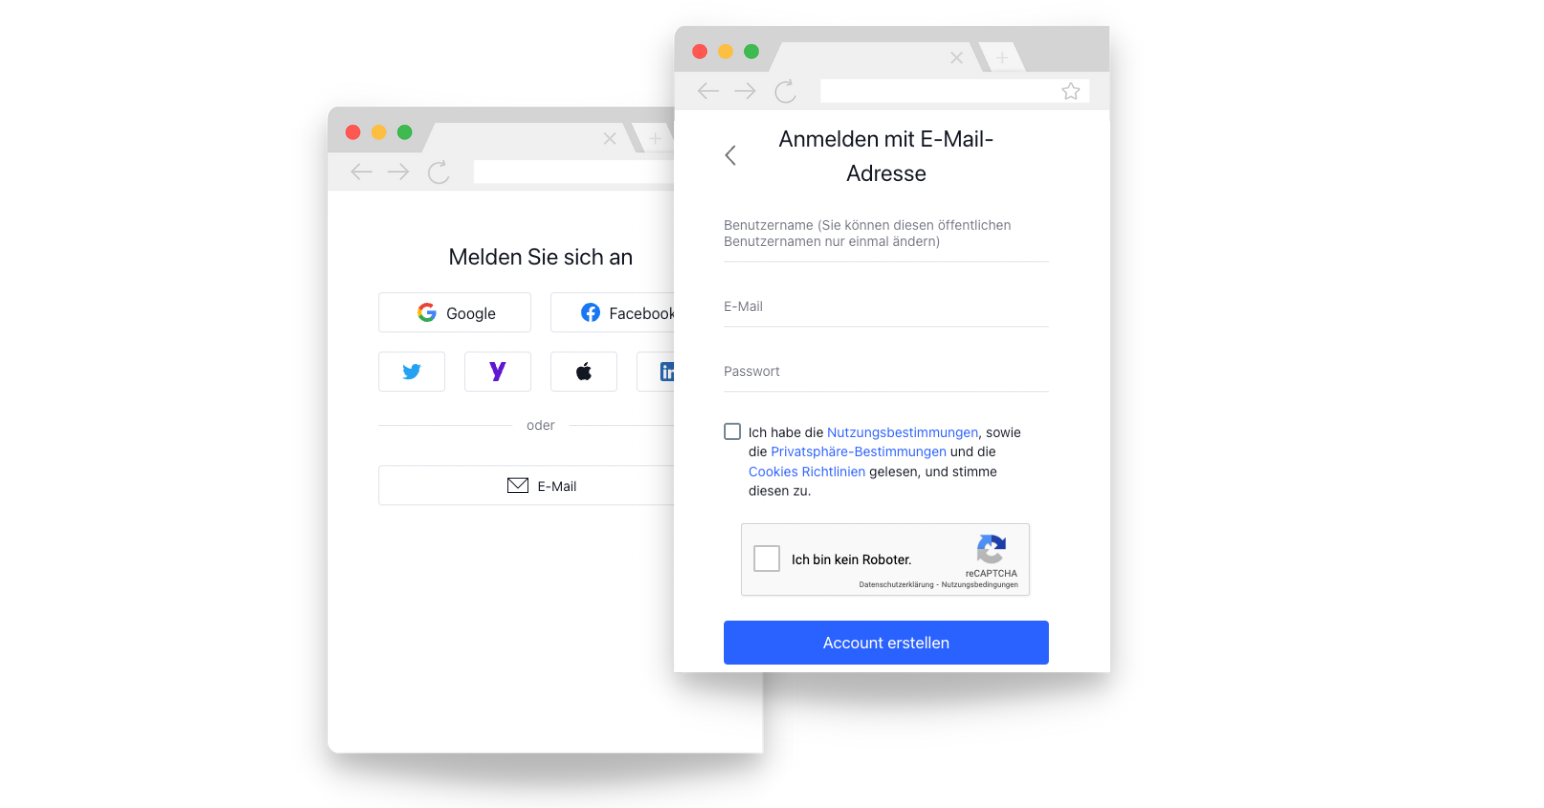
To open a free account with TradingView, click on the corresponding link under "Basic." As mentioned above, this is a bit more difficult to find on the TradingView website. For registration, you can either use an existing account from Google, Facebook, Twitter, Yahoo, Apple, or LinkedIn, or you can simply sign up directly with your email address. If you create your TradingView account through an existing account with the aforementioned third-party providers, you must provide your corresponding password there for legitimization. If you use your email address instead, you must choose a username in the next step and choose your email address plus password.

There are many ways to open your free TradingView account. You can either choose the path via a social media account or you can use your email address
For your first steps in TradingView, the free version is entirely sufficient. However, our experience shows that with increasing use, a switch to one of the paid versions is almost inevitable. You should find out which of these three models is best for you by comparing the subscription models. In general, we recommend our members to use the "Pro+" model because, from our experience, it offers the best value for money and can do everything you want in advanced knowledge.
After you have successfully completed registration, you can start right away. From now on, you have the option to save all your drawings, settings, and notes and retrieve them later. It doesn't matter which device you log into your account on. Whether on your tablet, smartphone, or another computer. Your data is stored in your account and can be accessed from anywhere.
Chart Types and Layouts
On TradingView, you have access to a variety of chart types, including line, bar, candle, and Heikin Ashi charts. Each chart type provides different information and can be used for different trading strategies. To get the most out of it, you should understand the essential differences between the various chart types. Specifically for trading, the candle chart is the most widely used chart type and is also prioritized by us and our trading education.
Indicators and Drawing Tools
Another important function of TradingView is the many indicators and drawing tools available. These tools can help you analyze market conditions and identify potential trading opportunities. TradingView provides you with a wide range of drawing tools, from simple lines and more complex patterns (trend lines, Fibonacci retracements) to text tools for writing annotations in the chart. The possibilities here are almost unlimited and work well and reliably – especially compared to other charting software.
TradingView also offers a wide range of indicators. You can easily search for your desired indicators and add them to the currently active chart layout with a simple click. By default, TradingView comes with all common indicators found in the literature or science (from trend indicators to volatility indicators).
Our experience shows, however, that indicators should only be used very sparingly. Only those that demonstrably fit the trading strategy should be used. Everything else should be considered a disturbance and distraction factor and should be reduced to a minimum.
When using indicators, you should follow the credo: "Less is more."
This collection is supplemented by user-created indicators. Because every user can program and use their own indicators. You will learn more about this later.
Analyzing with TradingView
Overview of Different Markets
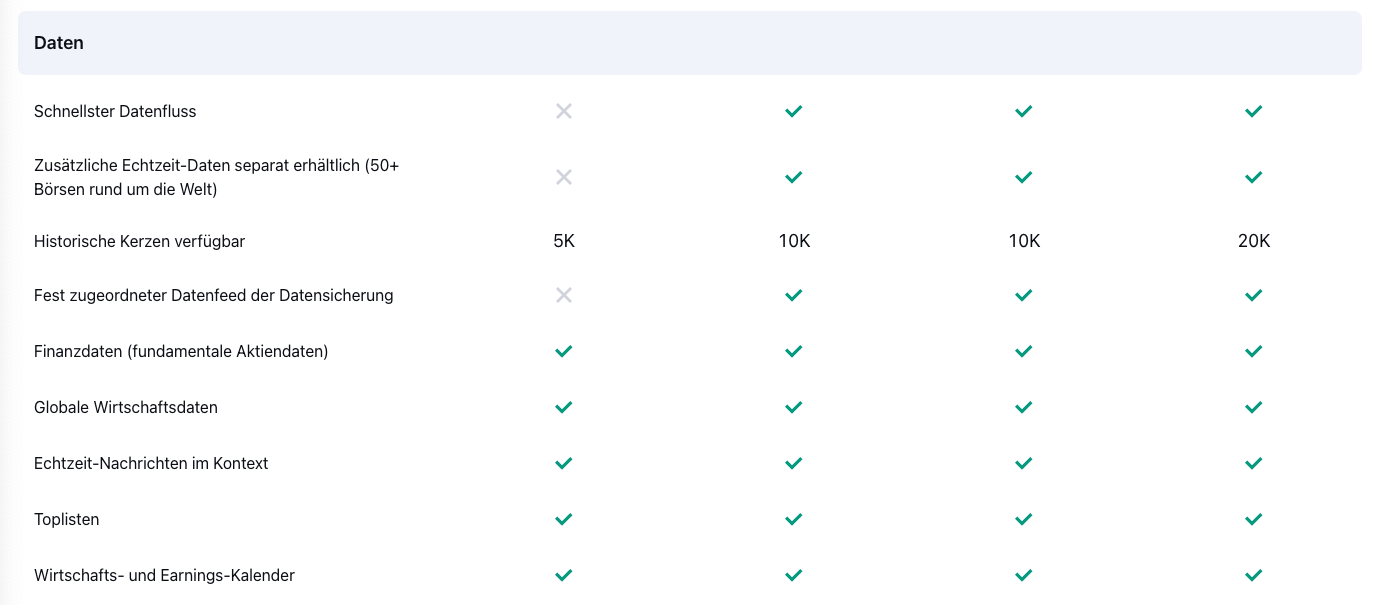
TradingView offers a wealth of information on a variety of markets, including stocks, forex, cryptocurrencies, and commodities. TradingView also provides the appropriate market data for the various symbols. However, it should be noted that these have certain limitations in the quality of this data. Especially in the Basic version, you will not be offered the data at the fastest speed, and you will only have access to a limited number of historical candles. Moreover, probably the most significant limitation, with a Basic account, you cannot activate additional real-time data. Therefore, active trading is almost impossible because you inevitably need this real-time data.

The excerpt from the TradingView subscription model comparison shows you the detailed differences between the individual models in the area of data
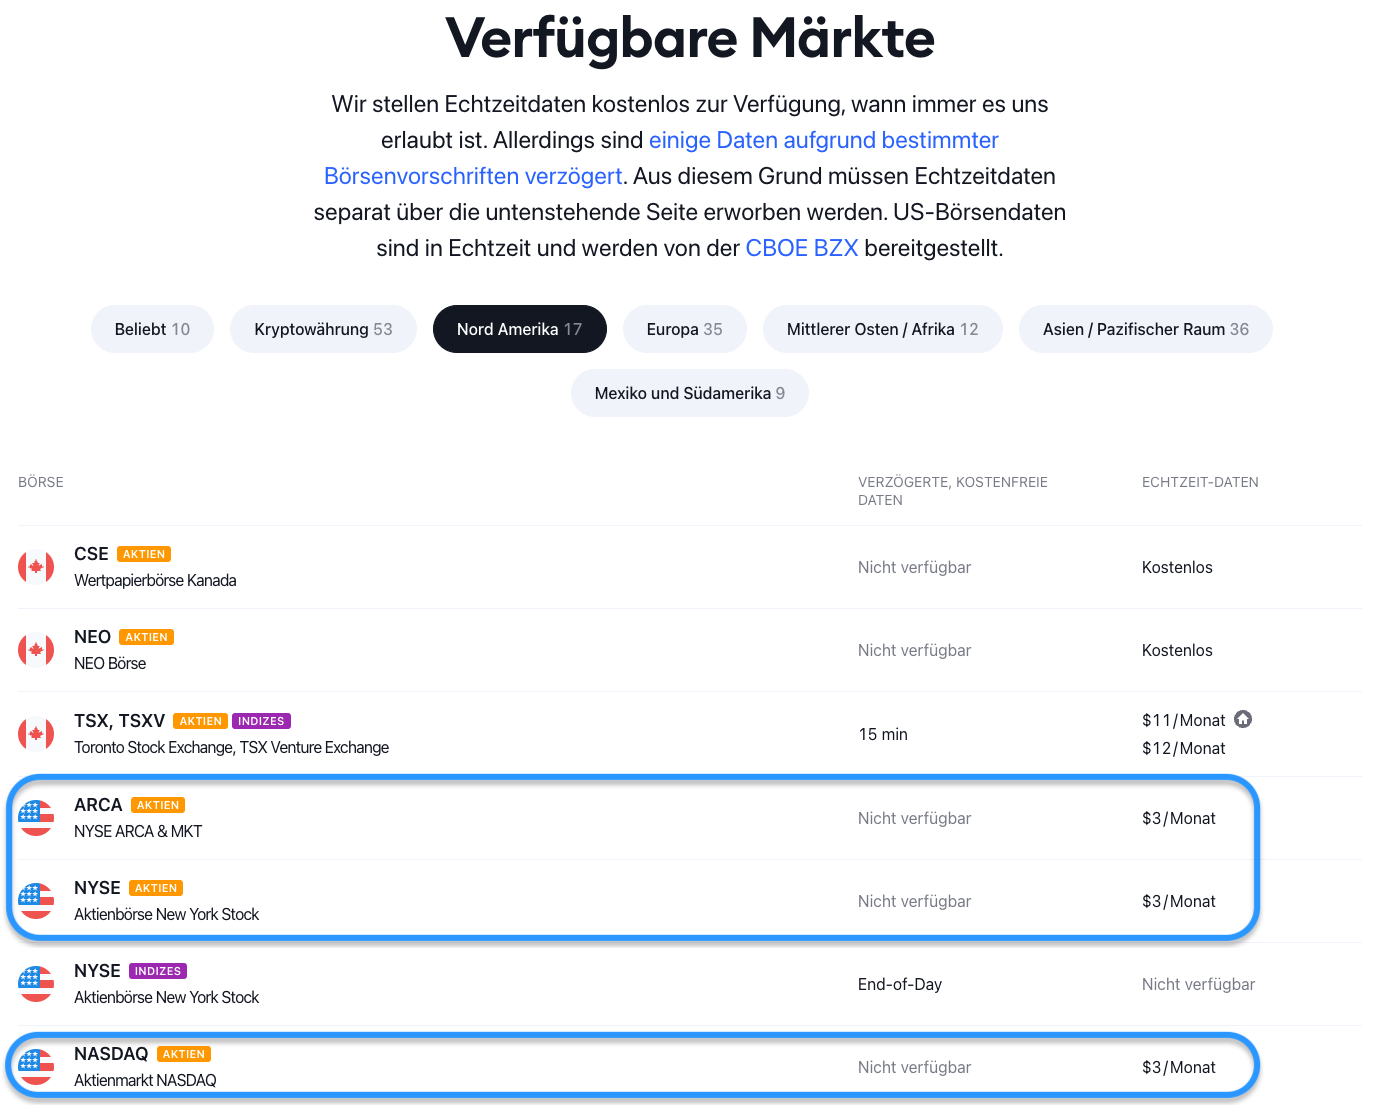
For each available market on TradingView, you usually have to subscribe to the appropriate market data. These usually cost a few dollars a month and ensure that you have the data in real-time – not delayed. You want to avoid this, of course. On the TradingView market data overview page, you will find all available markets that you can additionally subscribe to via TradingView. Depending on which market you are interested in, you will also see whether there are any delayed, free data (these are then displayed with a delay) or what the corresponding real-time data costs per month.
If you want to trade US stocks, as we teach you in our courses, we recommend that our students subscribe to the following three market data:
- NASDAQ
- NYSE
- ARCA

The overview of available market data in TradingView. While some data is free, it comes with a 15-minute delay, making it unusable for live trading
From the overview, you can also see that there are no free, delayed data for these three market data. These three market data are among the largest exchanges worldwide, which is why you need them if you want to trade US stocks, which we strongly recommend at this point.
Understand Fundamental Analysis
TradingView also offers an extensive selection of fundamental data for all major stock exchanges. This way, you can see directly in the chart when the next earnings (quarterly figures) will be published or when the last ones were published. You have access to financial reports, valuation analyses, and over 100 other fundamental data and key figures. And most of it can be accessed directly from the chart, so you don't have to open another window.
Fundamental data plays a certain role in your trading. It also plays a role in our WMT framework, but only to a lesser extent. This does not mean that you can neglect it. It simply means that there are other market parameters that you should give greater importance to.
Market news on TradingView
Another important source of information in daily trading is market news. TradingView provides you with the most important news on various markets and financial instruments. However, this news is currently only rudimentary integrated and not really recommended. Therefore, we recommend our students to use the news platform, which specializes in this application case.
Different time intervals on TradingView
For meaningful analysis, the ability to examine different time intervals is indispensable. With TradingView, you can either choose from a selection of common time intervals (daily chart, hourly chart, 10-minute chart, etc.) or use completely individual time intervals (2-week chart, 17-hour chart, 6-minute chart, etc.). This means that there are no limits to your analysis and creativity.
Chart layouts on TradingView
TradingView has many features that allow you to make trading as effective as possible. One of these features is the ability to open up to 8 charts per tab. This way, traders can keep an eye on multiple symbols at the same time and quickly react when market trends change.
You can also synchronize symbols, intervals, and even drawings to get a better overview of market conditions. This allows them to make quick decisions and adjust their trades accordingly. In practice, this means that once you change a symbol on a chart, it is also changed on the other charts in the same way.
The combination of these features makes it possible to take trading to a new level and achieve a higher success rate.
Creating and sharing trading ideas on TradingView
Overview of TradingView's social features
Recently, TradingView has evolved from a pure charting platform into a comprehensive trading community. In doing so, TradingView has continually expanded and developed new areas in its app and associated homepage. The premise at TradingView is also that the power of the community should be used to achieve common goals. Therefore, TradingView offers numerous functions that should support every trader.
Collaborating with others on TradingView
The probably most popular feature is the ability to share trading ideas with other users. If you have a trading idea, you can publish it on TradingView and enable other users to see, comment and boost it. This allows you to interact with others, place your suggestions and own ideas, and learn more about them.
If you were then convinced of the trading idea, you can follow this trader - as you probably already know from other social media platforms. If you follow other traders, you will receive notifications about their activities, including their ideas, comments, and trades. This is especially useful if you are convinced of certain traders' trading ideas and do not want to miss anything when they post something on TradingView.
Interacting with other traders on TradingView
Another social feature of TradingView is the public chats (sometimes also translated as public conversations). These chats allow you to talk to other traders and exchange ideas. You can also join groups that specialize in specific markets, instruments, or trading strategies. You can find these groups using the search function and then exchange ideas with others on the topic.
In addition to this public chat, you also have the option of sending private messages within TradingView. The contents of private chats are only visible to you and the user(s) in the chat.
Furthermore, TradingView has created another new way to interact with other users and share their ideas: Minds (translated into German as Thoughts ). Depending on which symbol you are currently analyzing, you can publicly post your thoughts specifically on this symbol. This also means that you see the thoughts of others on this symbol. Finally, it is similar to public chats, but really limited to the respective symbol.
How to create and publish trading ideas on TradingView
To create and publish trading ideas on TradingView, you first need to click on the "Publish" button, which is located on the upper-right side of the screen. Then another menu opens, in which you have to select the exact type of your publication. There you have the choice between a normal trading idea , a video idea , starting a live stream , or you can use the already mentioned function Minds or thoughts at this point.
Next, you need to enter a title and a meaningful idea description of your trading idea that explains your analysis and communicates it in a way that is understandable to everyone. In addition, you can upload either a chart or an image to illustrate your idea.
In the right-hand section of the window, you can find additional settings for your idea and, for example, select the visibility of your idea (public or private), set the type (analysis or tutorial), the type of investment strategy of your idea (long, neutral, or short), and to which category your idea can be assigned.
When you're done, simply click "Publish Public Idea" to make it available to the TradingView community.
It is important to note that no ideas can be posted publicly that have a time interval of less than 15 minutes. Such ideas can only be published privately.
Transitioning into trading thanks to TradingView
Backtesting and paper trading with TradingView
Another important feature of TradingView is the ability to backtest and paper trade. Backtesting simulates the performance of a specific trading strategy based on historical data. This allows you to find out if a particular strategy had been successful in the past and how it would have behaved in different market conditions.
With paper trading , on the other hand, the aim is to test a trading strategy or trading as such in real time without using real money. Instead, virtual capital is used to execute trades. Therefore, this is also commonly referred to as demo trading.
Both are particularly useful for beginners and traders with limited budgets, as they can gain experience and improve their trading strategies without risk and costs.
Integration of TradingView with other trading platforms and brokers
TradingView offers a seamless integration with a variety of different brokers. This allows you to make your analyses directly in TradingView, gather all the necessary information and place the corresponding orders directly from TradingView. Another program or tab in your browser becomes unnecessary.
This integration also allows you to access real-time data and trading signals that may not be provided by your broker or trading platform.
Furthermore, TradingView also offers API integrations with other tools and platforms, allowing you to seamlessly integrate your trading data and analyzes into other applications. This is particularly useful for traders and investors who want to use complex trading systems and analysis tools.
How to set up alarms and notifications
To set up alarms and notifications in TradingView, you first need to select the instrument on which you want to set alarms in your chart. Click on the alarm icon in the toolbar. Then another menu opens in which you can refine the alarm settings further.
In this alarm menu, you can make further settings for the alarm. For example, at what price it should be triggered, the interval of the alarm, and an individual name and message that will be displayed when the alarm is triggered.
Under the "Notifications" tab, you can choose how you want to be notified, e.g. by email, SMS, or push notification.
As soon as the alarm is triggered, you will be notified and can react accordingly. Alarms can help you keep an eye on important price levels and quickly react to market changes.
TradingView's script language: Pine Script
TradingView also offers its users their own scripting language called Pine Script, which allows users to create their own indicators and strategies. Pine Script is very intuitive and easy to learn, as it is based on the syntax of JavaScript. There is also a large community of users who share their own Pine Script indicators and strategies, making it easier for users to create and improve their own. With Pine Script, users can also perform backtesting and paper trading to test and improve their trading strategies.
Do you really need TradingView for trading? - Conclusion
Final thoughts on TradingView as a trading tool
TradingView offers many features and benefits for traders, including the ability to share trading ideas and collaborate with other traders, use backtesting and paper trading to improve trading strategies, seamless integration with various brokers and trading platforms, setting up alarms and notifications to keep an eye on important price levels, and using Pine Script to create and improve their own indicators and strategies.
In conclusion, TradingView is an essential tool for every trader. It provides all the important features needed to trade successfully and gain an advantage over other traders. The seamless integration with a variety of brokers and trading platforms makes TradingView one of the most versatile trading platforms on the market. So, in our opinion, there is no way around TradingView if you are serious about trading.
Summary of TradingView's features and benefits
- Access to a variety of chart types, including line, bar, candle, and Heikin Ashi charts
- A wide range of indicators and drawing tools available
- Ability to use different time intervals for analysis
- Extensive selection of fundamental data for all markets
- Open up to 8 charts per tab and synchronize symbols, intervals and drawings
- Share trading ideas and exchange ideas with other traders
- Use backtesting and paper trading to improve trading strategy
- Seamless integration with a wide range of brokers and trading platforms
- Set up alerts and notifications to keep an eye on important price levels
- Create and improve your own indicators and strategies with Pine Script