What are Chart Patterns?
Chart patterns are nothing more than recurring shapes in the market. These patterns usually refer to geometric shapes that we know from math class. That means, for example, we are looking for triangles, rectangles, and much more. On the one hand, we have the advantage that repeating patterns always have the same structure, and on the other hand, the market usually behaves according to the same rules within these patterns.
Which Chart Patterns You Should Know
Channels
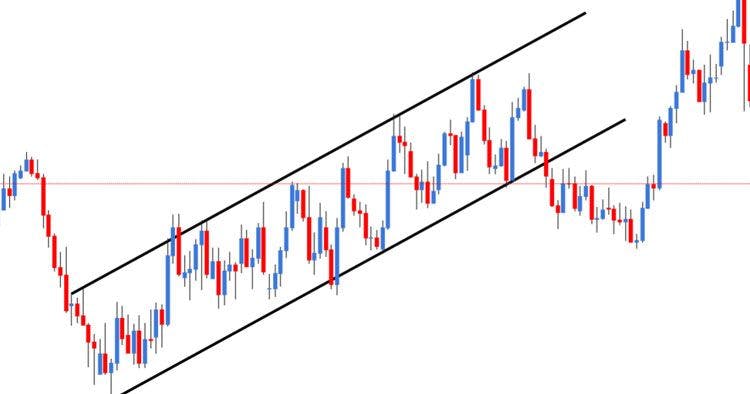
We start with one of the most well-known chart patterns, the Channel. The main characteristic of a channel is two diagonals that run parallel. It's important that the channel is tilted, so it doesn't run horizontally. If the channel runs horizontally, we speak of a Rectangle. But more on that in the following section. Let's take a look at the following image:
The chart pattern of the channel drawn in the chart
Here you can see a classic channel. You can see how the price moves evenly between the two edges (parallel lines). If we can draw a channel, this speaks for a very even and harmonious trend. How can we use this to our advantage? A trend line requires two touches to even be drawn, and the third touch confirms your assumption of the trend line. We can use this principle to enter within channels. So, for example, if we have an uptrend, we want to enter the trend with the 3rd (or higher) touch of the lower trendline. We want to place the stop loss below the trendline and set our targets at the latest with the touch of the upper trendline (as we assume that the price will bounce back). This would be a sensible way to use Channels for your trading.
Rectangles
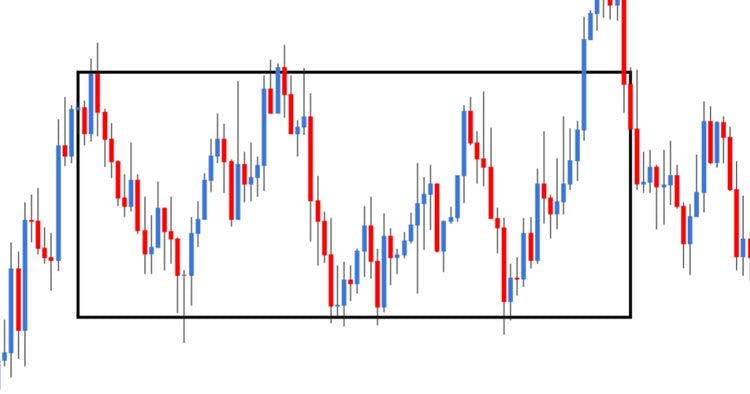
The Rectangles are very similar to the Channel. However, the rectangle does not run up or down but horizontally. You may also know the rectangle as a harmonious sideways phase. In the figure, you can see that we have an upper and a lower edge that is accepted by the market.
The rectangle drawn in the chart
Just like with the channel, we can enter trend direction with the edges. We use the same rules for this. In addition, we can follow another entry here: the breakout. We wait for the price to break out of the rectangle and then enter. This gives us the confirmation and the probability that the trend will continue. We wait for the price to close above or below the lower edge. We see this as confirmation of the breakout and can enter. If you want to get a better risk-reward ratio, wait for the pullback to the edge that now serves as support.
Head & Shoulder and Inverted Head & Shoulder
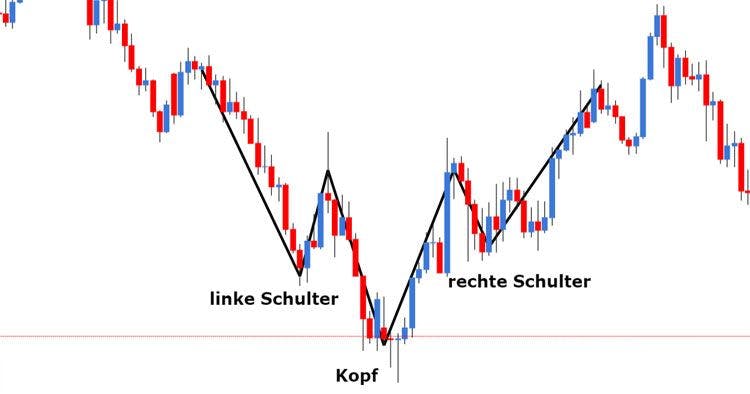
The Head and Shoulder pattern or more precisely Shoulder-Head-Shoulder is a very well-known pattern in trading. The Head & Shoulder pattern is a trend reversal pattern. So if we find such a pattern, we assume that the trend is changing. The following figure gives you an idea of where the name of the pattern comes from:
The Head-Shoulder-Formation
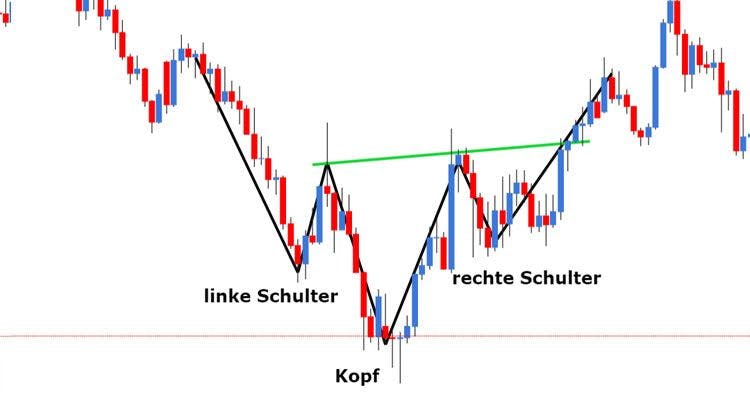
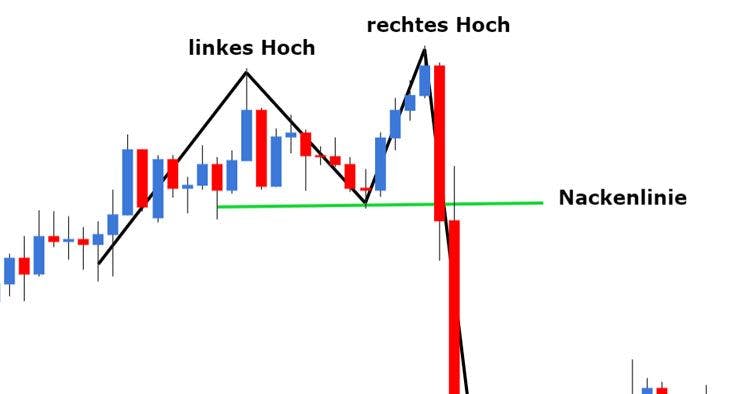
You can see the two "shoulders" of the pattern on the right and left. The peak in the middle is called the "head." This is an example of an Inverted Head & Shoulder pattern. If we turn the whole thing around, we speak of a classic Head & Shoulder. For this chart pattern, there are two possibilities for trading. On the one hand, we anticipate the right shoulder if it is not yet available. This means we see the left shoulder and the head, and now assume that the right shoulder will be formed. In most cases, the right shoulder is just as big as the left, and we can say where the right shoulder must turn. So, we can enter the trend reversal with the right shoulder. The other possibility is to enter with the break of the neckline. So, what is the neckline now? Take a look at the following image:
Dhe Head-Shoulder-Formation including the so-called neckline drawn
Double Top and Double Bottom
The two absolute classics: the Double Top and Double Bottom. Super simple, but also super effective. We are looking for two peaks. The Double Top and the Double Bottom are also trend reversal patterns. We can use these particularly well in setbacks on smaller timeframes or to recognize trend fatigue. Let's take a closer look at the Double Top:
Here in the illustration, you can see a Double Top as an example, including a break of the neckline, which can be interpreted as an entry signal
You can see an formed Double Top here. On the left, a high and another one next to it. So we need two peaks. In between, we need "space," more precisely enough "room." A sign of enough space is a "V" between the highs. Now it gets a bit more complicated. Let's take a look at the candles of the two highs. We have to fulfill the following rules: We must not close above the left high. We must reach at least the opening price of the left candle with the right high. Only when these two rules are fulfilled do we have (initially) a valid Double Top. For the Double Bottom, the exact opposite rules apply. On the one hand, we can enter with the right high (once the rules mentioned above have been fulfilled). We could do this on a lower timeframe. The Double Top forms in the daily chart and meets all the rules, then we can look for our setup in the right high in the 4-hour chart. Secondly, we could also enter with the break and closing price of the neckline. Because actually, a Double Top (or Double Bottom) is only really valid with the closing price below (or above) the neckline. The neckline is simply the lowest point of the "V" in the case of a Double Top or the highest point of the inverted "V" in the case of a Double Bottom. If the price closes below in the case of the Double Bottom, we can enter with the setback.
Triangles and Wedges
Triangles and Wedges are very common chart patterns and, like the Rectangle, belong to the breakout patterns, so we expect a breakout in the foreseeable future. The Triangle and Wedge are very similar; they only differ in the angle:
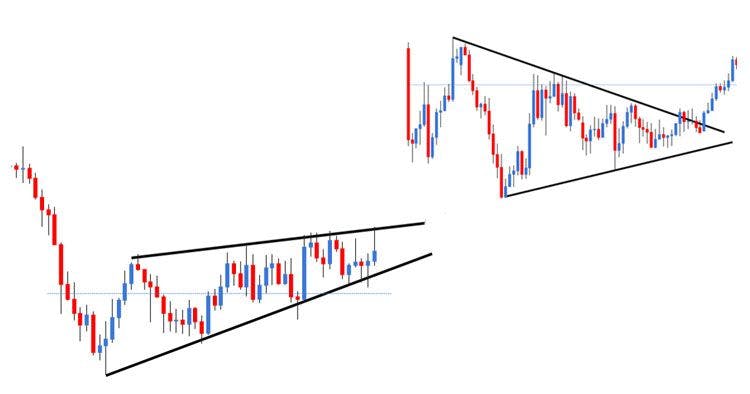
The Triangle and Wedge chart patterns compared schematically
Both patterns feature two converging trendlines. The range narrows. On the left, we see a Wedge, and on the right, a Triangle. The price always has smaller fluctuations, and this ultimately leads to the breakout of the Triangle or Wedge. There are again two different possibilities for entry. On the one hand, we can trade within such a pattern. This is possible if the patterns are huge or if we trade the whole thing on a smaller timeframe. On the other hand, we can also trade the breakout. We wait for the breakout, i.e., the closing price above or below one of the trendlines, and then enter with the setback.
Flag and Pennant
Basically, Flags and Pennants are two special forms of Triangles and Wedges. The flag has two parallel edges, the Wedge two converging ones. The same rules apply, but before the Flags and Wedges, we have a long impulse, the so-called Pole. The difference to the classic triangles and flags is that this pole gives us a trend direction. A triangle can break out in both directions. A flag (or pennant) can also break out, but the probability is higher that it continues the current trend. In addition, a much stronger breakout is expected because flags and pennants usually move in a smaller range and, therefore, the breakout is stronger in relation. Entries can be made just like with triangles and wedges.