Types of Charts - Why are there so many?
Before we can answer the question of why there are so many different types of charts, we first need to understand what they all have in common: price. Everyone is familiar with the image of the stock exchange board in the background, updating the price of a stock every second. Humans have a very limited attention span, and it's difficult for us to store and process large amounts of numbers. Therefore, stock prices that change several times per second are suboptimal for us. What we can do better as humans is interpreting data in visual form. This is precisely what charts do. Charts visualize the numbers of the stock market for our eyes. This allows us to build an understanding of what we're seeing in just a few seconds. Much faster than we would be able to with only numerical data. Over time, various chart types have developed for functional, cultural, and subjective reasons.
Short Excursion: Time Frame
Before we dive into the matter, we need to briefly discuss the term "time frame." In this case, the term is even somewhat incorrect, as we can also use other intervals. Let's start with the time frame: Each chart can be displayed in different time frames. Depending on which time frame we choose, different price intervals are used. For example, when we look at the daily chart, the opening and closing prices of each day are usually used to form the charts. We intentionally exclude intraday movements here, meaning that the daily chart still moves within the day. For understanding, the simpler version is sufficient.
In the figure, you can see the daily chart (left) and an example of what a certain section of it looks like in the 4-hour chart (right).
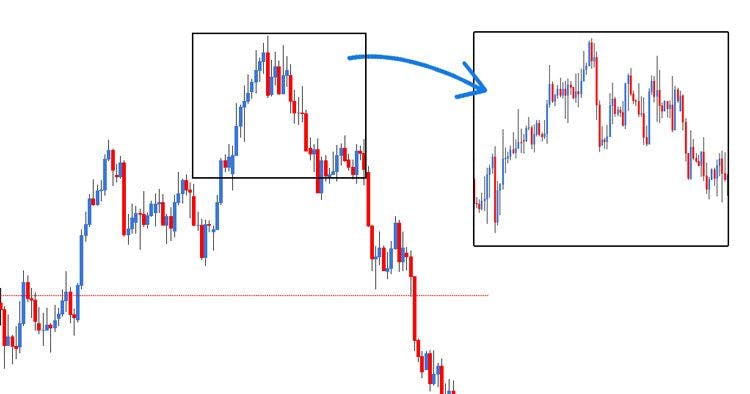
The direct comparison of a daily chart and a section of it in the 4-hour chart
When we move into more complex territory, the chart can also be formed based on so-called ranges. Time becomes secondary. This means we specify a certain range of movement with which the chart is then formed. This is the case with the Renko chart, for example.
The Different Charts Compared
Line Chart
The line chart is one of the absolute classics in the world of charts. As the name suggests, this type consists only of a line.
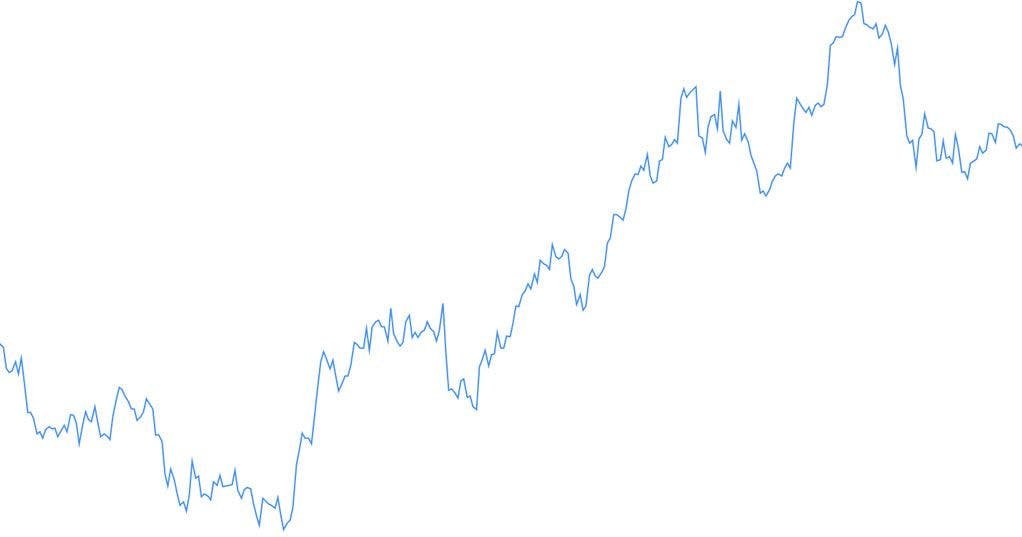
One of the classic chart types: the line chart
The line chart is frequently used in classical stock analyses in the investment sector. The line connects various time-dependent points, such as the closing prices of a stock. Depending on the setting, the line chart can also represent the opening prices of a certain time interval.
This chart is relatively simple and clean, which is why it is frequently chosen. However, this is also its major disadvantage. Because the line chart is so simple, it simply lacks information. This does not necessarily mean that this type is bad. It just means that it may not be suitable for all requirements. If our goal is to invest in assets in the long term, fundamental data is more important than the daily high, low, or opening prices. In this case, the more abstract image of the line chart is sufficient. If we move more into trading, the line chart is only suitable to a limited extent. The information it provides is simply too small to make informed decisions.
Candlestick Chart - The Classic in Trading
The candlestick chart is particularly widespread in trading (day trading, swing trading & position trading). As you can see in the following image, the candlestick chart consists of many small "candles":
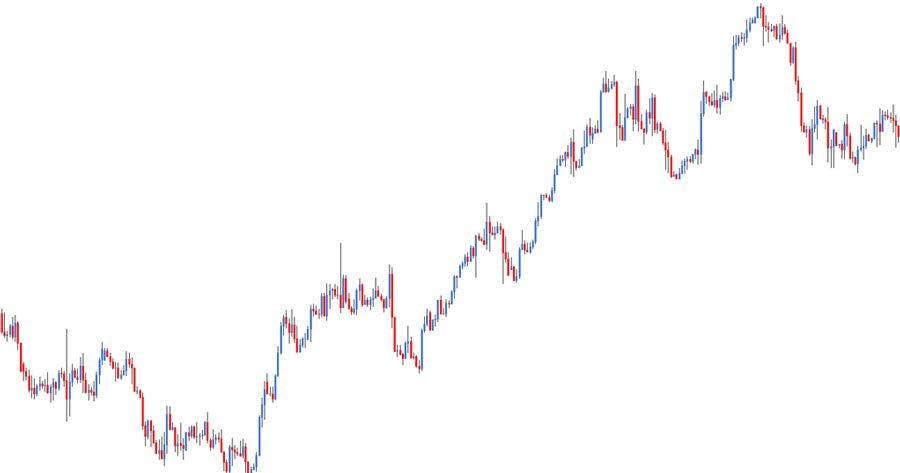
More suitable for trading: the candlestick chart
Each individual candle in the candlestick chart represents a unit of time. If the above chart is a daily chart, each candle represents one day. If the chart is an hourly chart, each candle represents one hour, and so on.
A candle in this chart type consists of a candle body and two wicks (hence the name). The following figure shows you the schematic structure. It's important to mention that the candle can also have only one or no wick. This is the case when the high (or low) is simultaneously an opening or closing price.
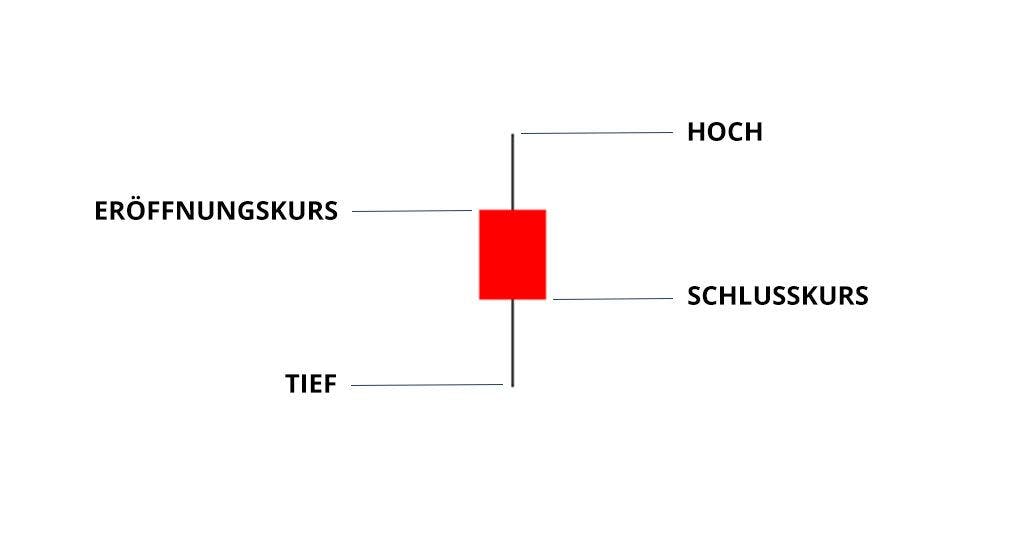
Schematic representation of a candlestick, including a description of its components
The highest point of the upper wick is the candle high. The upper end of the red body is the opening price. The lower end of the body is the closing price, and the lowest point of the lower wick is the candle low. If the opening price is above the closing price, we have a red candle (falling price). If the opening price is below the closing price, the candle is green (rising price).
The advantage of the candlestick chart is obvious: We have four data points in one graphical element. This is both an advantage and a disadvantage because, on the one hand, a trained eye can quickly extract the essential information and make appropriate decisions. On the other hand, the information overload can be overwhelming.
Bar Chart - The Clean Alternative to the Candlestick Chart
The bar chart is relatively similar to the candlestick chart and offers a real alternative for beginners to the candlestick chart, as it appears more orderly.
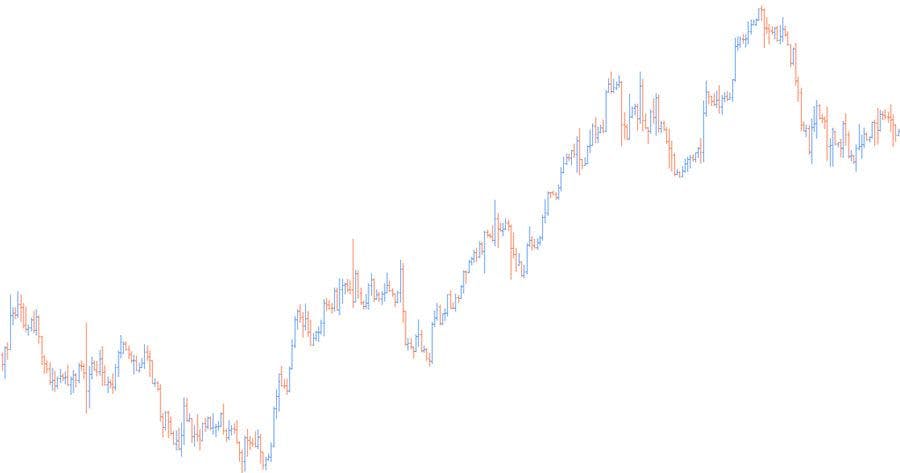
Bar chart in trading
In the case of the bar chart, you also recognize the familiar red or green elements, but the candle bodies are missing. The bar chart defines the opening and closing prices using small horizontal lines that extend to the left (opening price) and right (closing price).
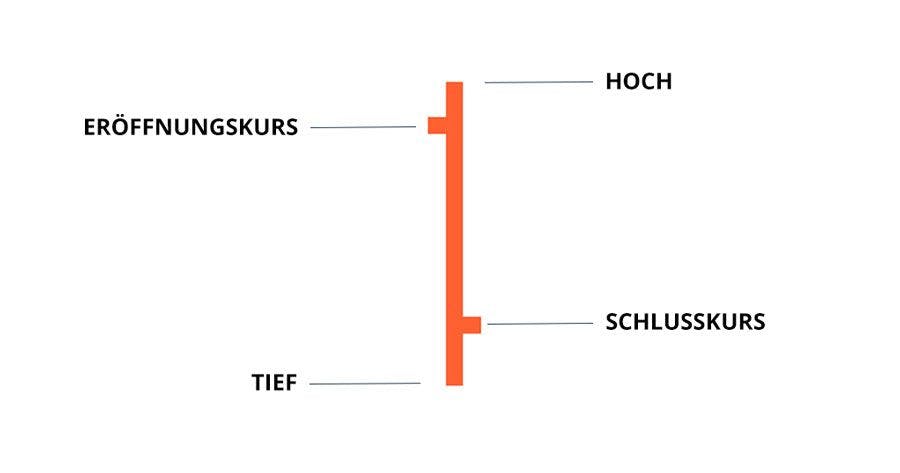
Schematic representation of a bar in the bar chart
Let's proceed schematically here, too: The upper end forms the absolute high. In this case, the left "branch" represents the opening price, and the right branch represents the closing price. The arrangement determines whether it is a red or green candle. If the closing price is above the opening price, we have a green candle. Finally, the lower end forms the absolute low. The advantage of the bar chart is that it appears more minimalist. The big disadvantage is that price movements cannot be read as intuitively as in the candlestick chart.
Range Bar Charts - The Slightly Different Perspective
The range bar chart does not follow, as with the previously discussed charts, any temporal factors but rather a range. Let's take a look at the range bar chart:
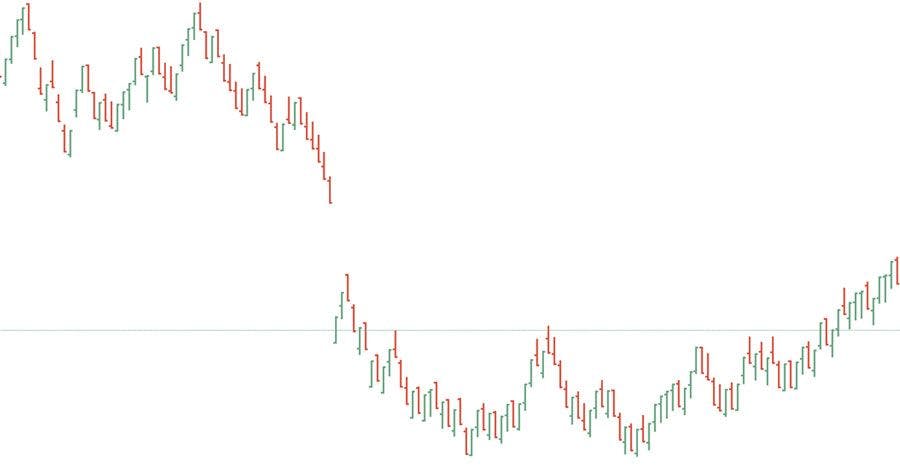
The range bar chart in trading
At first glance, the range bar chart looks very similar to the bar chart. But the big difference is that the range bar chart is temporally decoupled. This means that new elements are only created here when the price of a stock has changed by a previously set range. So if we have set our range at $1, a new element is only created when the stock has changed by this range ($1). This rule applies to both trading directions. The advantage is that the chart removes temporal coupling. As a result, we have a chart that focuses on relevant developments and removes irrelevant movements from the chart.
Renko Chart - Brick by Brick
According to legend, this chart type was developed in Japan 500 years ago. "Renko" means "brick" in Japanese, which is also evident from its appearance.
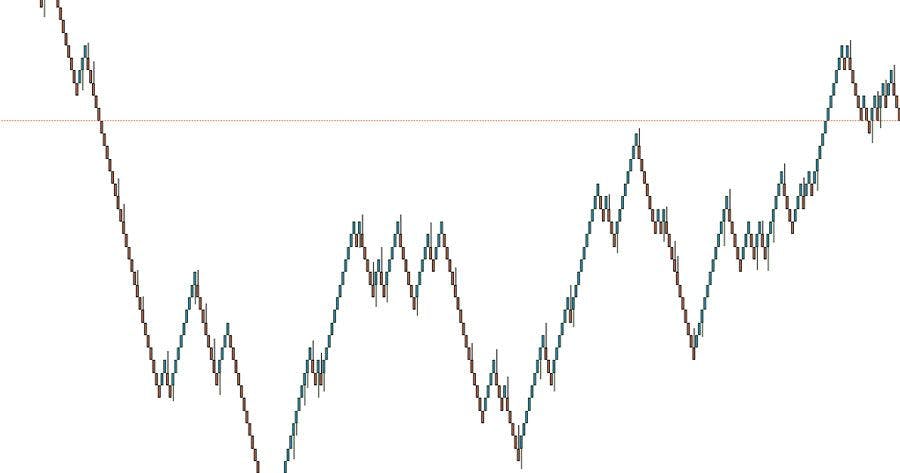
The Japanese Renko chart type is represented by bricks
The Renko chart is quite similar in principle to the range bar chart. However, there are no wicks in the Renko chart. So, we define a "range" of, for example, one dollar. Now, however, the Renko candle is only formed when the price has gone up or down by one dollar. An example:
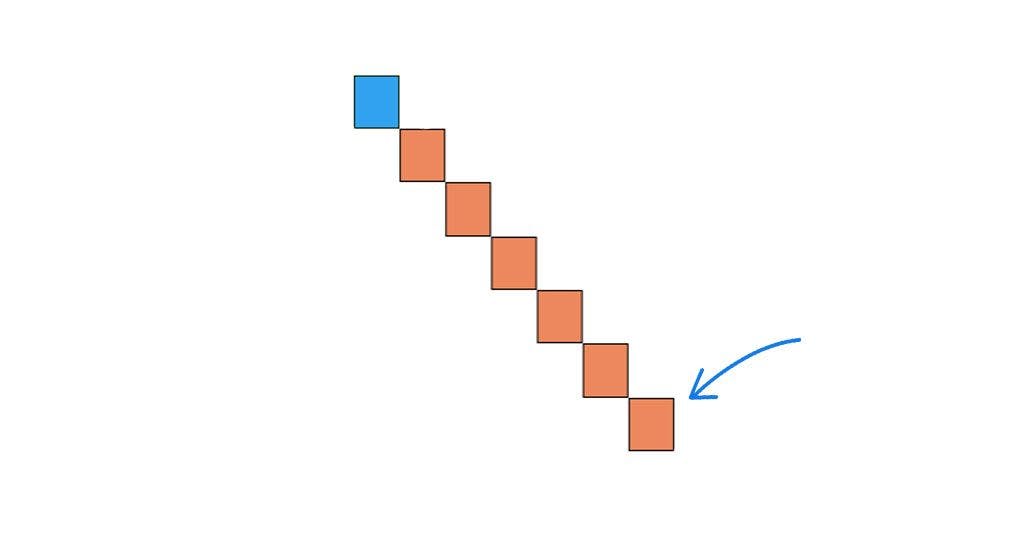
A single Renko candle schematically represented
If the price either rises by one dollar or falls by one dollar, a new red or green Renko brick is created. The same advantages and disadvantages apply to the Renko chart as to the bar range chart.
Heikin Ashi - Magic from the Far East
Whether the Heikin Ashi belongs to the chart types or indicators can be debated. The Heikin Ashi is based on the classic candlestick chart. However, the Heikin Ashi smooths it out a bit and brings a little more calm to the chart image.
The opening price of the current candle is calculated from the half-sum of the opening and closing prices of the previous candle. The closing price of the current candle is calculated from the quarter-sum of the opening, closing, high, and low prices of the current candle. The high and low prices are calculated normally, with the extreme values. This results in a very harmonious chart image without gaps. Larger and smaller candles have particularly great importance in the Heikin Ashi chart.
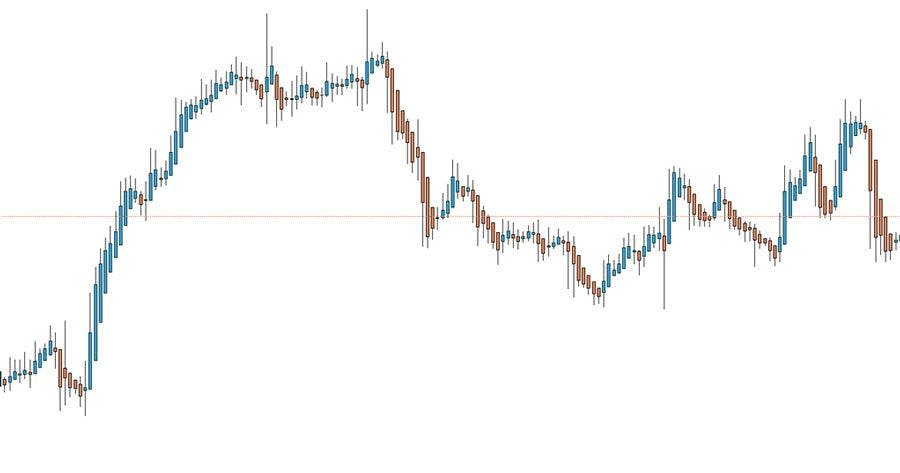
The Heiken Ashi chart type, also from Japan, is similar to the classic candlestick chart but smoothes out certain values, making the chart look more harmonious
But beware, this somewhat more complex calculation is a major disadvantage of the Heikin Ashi. Backtesting is particularly difficult here because the chart doesn't depict every reached price. Also, you always have to wait until the candles have formed since otherwise, no interpretation is possible.
Summary
Choosing the "right" chart type mainly depends on the individual requirements and preferences of the user. Each chart has its advantages and disadvantages, and different chart types are suitable for different trading styles. The most important thing is to understand the chart type you want to use and to use it consistently.